Things to consider for Fractional Revenue Attribution

Revenue attribution is the hottest topic these days.  Proliferation of online media, requires reshuffling marketing spend across many more spend categories.  Traditional funnel-engineering type work is good, but static, and doesn’t address a few key issues.

1) The transient nature of marketing spend effectiveness that comes and goes with changing keywords, banners offers

2) It does not address the problem in a customer-centric manner (in fact orders are placed by customers who clicked on a keyword, or received a catalog)

The new marketing spend effectiveness paradigm involves understanding causality of relationship between marketing and sales at a transactional level using statistical methods to fractionally attribute.  There are five elements at play;

  1. Order of events:  what sequencing (0rder) of actions lead to sales transactions
  2. Combined effects: what is the joint effects of marketing touches
  3. Frequency: how many touches are required to convert a prospect to a buyer
  4. Time decay:  How the effects of marketing->sales decay with time passed
  5. Effectiveness: what is the relative efficacy of each vehicle is different (e.g., banner view is not the same effectiveness as a 52 pg. catalog)

How this problem can be expressed in mathematical terms and the solution is quite sophisticated and i can not get into it since this is our core IP at Agilone.

Once an attribution could be made, the next issue is how to measure the effects of overspending, which i will get into in the next post.  The inherent problem in fractional attribution is how to make sure that by increasing marketing spend on one vehicle will most likely (and not by causality) reduce the effectiveness of other existing spend elements.

Big Data question: what to save for how long?

As tools in the big data world emerges and mature, question is how much of the data to save in high versus low resolution.  The answer depends on the uses of this data.  Recently, i’ve had lunch with someone from Yahoo, where they were doing modeling on full-resolution data and claimed that you need big-data tools (hadoop, mahout) to build predictive models. 

The problem with predictive algorithms requiring more data only arises if the number of independent variables that are predictive is large.  Higher number of variables require larger datasets to train classification models (see Richard Bellman’s curse of dimensionality, the godfather of dynamic programming).  In any case, the big data gives us a 1-2 orders of magnitude higher processing power, which only allows for a few more variables, as the volume of data required increases exponentially with new variables. 

Perhaps the more important question to ask is why we need and how much data we need to do what we need to do.  In our focus, we provide marketing analytics to our clients, so our focus is marketing.  In the case of mining web analytics logs, there are apparently four uses

  1. Revenue Attribution
  2. Modeling
  3. Triggering marketing actions
  4. Building temporal statistics on customer actions

These four topics require data to be saved for various

  1. Length of time
  2. Resolution

Here is a simple depiction of the uses by resolution and data retention.

Determining how much to keep after then initial 90 days or so depends on the modeling uses.  If the models being built have a natural 3-4% response rate, you need data that is approximately double that, so you are properly representing negative outcome events (actually oversampling success events).  This level of data retention is enough for doing most propensity and event modeling exercises, since the data is actually pretty large.

How to forecast using customer ensemble dynamics

Forecasting sales always come up as CFOs continue to push for accountability from Marketing departments.  From a marketing perspective, forecasting provide focus, goals and budgets.  At a high level, marketing departments goal to acquire, grow and retain customers map one-to-one to sales forecast.  Looking at forecasting from customer lens (causal or ensemble) rather than a time-series (non-causal) uncovers causal reasons behind results, hence providing metrics to monitor and correct.

For example, number of customers, order per customer, revenue per order and margin% per order are simple factors that yield the sales, each of which are metrics a marketer knows and manages.  The multiplication of which (over time) yields a revenue and margin forecast.

In a B2B environment, predictions are easier, based on quota of each salesperson and their book of business.  In B2C, the challenge is different, since there are no official account assignment that happens and account management is done at a macro level by marketing.  So how do you forecast based on an ensemble of customers.

One of the answers is ensemble forecasting, based on similar problem of forecasting weather patterns.  Given the weather and underlying dynamics at a point in time, the models would forecast the next period, which is then iterated over time.

Ensemble forecasting tries to predict the future state of a dynamic system.  In this case, the dynamic system is a collection of customers, each with a different buying pattern and relationship with the company.  New customers, high value customers, single-category buyers, all exhibit different behavior.  Forecasting  individual behavior is a common area of modeling usually referred as response modeling.  Here the idea is to predict how an ensemble of individuals would behave. 

Ensemle forecasting is a numerical method that is a form of Monte Carlo method that utilizes probability distributions and varying initial conditions and external assumptions that produces accurate results.

In the specific case of forecasting customer dynamics and sales, new customer acquisition and retention rates are probabilistic inputs to the system.

predictive modeling – methods and uses

Predictive modeling is a set of statistical procedures designed to predict a set of outcomes based on measured variables, assumptions and inputs.  In a broader sense, it includes product recommendations, but for practical purposes, we’re limiting it here to responses to marketing actions.

Predictive modeling is used in marketing for 4 reasons 

  1. Marketing spend effectiveness (How much to spend)
  2. Targeting (Who to target)
  3. Promotion differentiation (How to differentiate offers)
  4. Contact strategy (How to contact customers over time)
1. Marketing Spend Effectiveness
 
Marketing spend effectiveness (MSE) deals with optimally allocating marketing budget against activities and marketing vehicles.  In case of direct marketing, it deals with how many people we should contact given the cost and benefit (incremental or total).
 
Through predictive modeling, a response (or incremental response) is calculated and converted into expected margin.  Comparing this margin expectation at a customer level is compared against the cost of the marketing action.  The point when the benefit is equal to the cost,  is the point of optimal spend, where any additional spend returns less than the cost of the action
 
2. Targeting
 
Targeting deals with how to choose the people for marketing.  Predictive models create a score for each customer, which could be sorted and selected against.  Understanding where customers fall within the spectrum leads to offer differentiation
 
3. Promotion differentiation
 
Most often, mass campaigns cannibalize margin, due to the fact that we’ll be giving away discount to people who would have bought anyway.  This is probably the most important statement. So much margin is lost from campaigns this way.  Predictive modeling allows marketers to target offers so the customers likely to buy anyway are not offered discounts as much as people who are not likely to buy.
 
4. Contact strategy
Predictive analytics allows contruction of contact strategies where customers are selected for campaigns that they are likely to response.  This is more important in cases where the cost of campaign is small but the opportunity cost is high.  Opportunity cost comes in two flavors.  First of all it is the cost of doing something else, second is losing the ability to market to the consumer, as in the case when consumer unsubscribes from email.
 

How to improve revenue and margin through surgical pricing and promotions

Understanding the factors and accurately predicting customer responses to marketing is an area of analytical marketing that allows targeting the most likely customers to buy. These models are built by calculating various customer attributes (such as AOV, Time between orders, time since last order, number of categories bought from etc.), then putting these variables in a statistical predictive model to estimate the probability of customer coming back. The modeling technique is a separate subject, here I’d like to review how these models could be used.

  1. Determine target depth (How much to spend?)
  2. Determine target audience (Who to spend it on?)
  3. Differentiate offers

The topic of this post is to discuss item 3, offer differentiation. For simplicity sake, let’s assume that our model produced 3 segments, High, Medium and Low propensity buyers. The average behavior of these people are given below as an illustrative example:

Segment Population Probability of Purchase in the next 30 days Gross Margin Per Order Cost per Touch (assuming $1.00 cost per piece) Net Profit (Gross Margin – Cost of Response) Net Profit From Segment
High Propensity

100

10%

$50

$10.00

$45

$450

Med. Propensity

200

5%

$50

$20.00

$30

$300

Low Propensity

1000

1%

$50

$100.00

-($50)

-$500


Total

$250


In the above scenario, there are two choices to make.

  1. Accept the fact that low propensity segment is “reactivation” and assume the negative cost as “reacquisition cost”, reset the clock on these people and start re-measuring lifetime value on these people
  2. Find a way to increase the response rate of these people

Let’s exercise the impact of a pricing discount to these lower propensity segments. The idea is to selectively discount for these people that minimize margin cannibalization (another important topic on this subject, however, I’ll talk about this later)

Segment Population Probability of Purchase in the next 30 days Gross Margin Per Order Cost per Touch (assuming $1.00 cost per piece) Pricing Discount Net Profit (Gross Margin – Cost of Response) Net Profit From Segment
High Propensity

100

10%

$50

$10.00

0%

$45

$450

Med. Propensity

200

8%

$35

$12.00

15%

$23

$368

Low Propensity

1000

4%

$20

$25.00

30%

-($5)

-$200


Total

$618


Notice four things;

  1. Due to discount, response rate have increased. This lowers the cost per touch
  2. Gross Margin per order has decreased due to discounting (here I used 50% gross margin prior to discount, i.e., $100 AOV)
  3. Net profit per order decreased per order for med. Propensity segment, but increased for low propensity segment. This is where testing will yield the optimal answer of how much to discount to generate the right behavior.
  4. Even though net profit decreased per order for the med. Propensity segment, since response rate increased, the total profit increased for this and total segments

Of course trial of various offers will make fine tune the outcome. The other thing to consider here is the incrementality of the profitability, which is another area I will discuss.

Notes on our trial of columnar databases for analytics

In the past 3-4 years we started hearing about a new breed of database vendors. Unlike traditional row-based relational database engines such as , Microsoft SQL Server, Oracle, Sybase, these databases are column oriented.  What this means is that instead of writing and reading a record in row format.  Wikipedia has a deeper explanation of this technology at  http://en.wikipedia.org/wiki/Column-oriented_DBMS .  The theory is old, but the application and commercialization of it is quite new.  It is mostly driven by the change in need from write speed to read speed, especially for really large data sets, such as click stream data.

In marketing analytics, our typical approach is to combine data from multiple systems, such as

  • Transactional (order mgmt system, CRM system, Quoting System)
  • Telephone switches
  • Web analytics platforms (Coremetrics, Omniture etc.)
  • Email Service Providers (ExactTarget, Epsilon etc.)
  • Shipment Delivery (Fedex etc.)
  • Promotion Mgmt systems
  • Keyword Bidding platforms

among others.  The process we go through I believe is  a typical one, where we

  1. Combine data to come up with a 360 view of the customer, through properly putting the data together (“proper” means address correction, householding, geocoding, deduping, merging, standardizing, imputing etc.)
  2. Calculate various attibutes (such as first order source, first order date type customer and other related attributed required for marketing analytics)
  3. Transform the data into our universal data model and BI framework (fact and dimensional tables)
  4. Build multi-dimensional OLAP cubes and various other reports
  5. Iterate various statistical models for propensity modeling, product affinity etc. for targeting, testing, spend optimization, personalization etc.

We believe the steps we take are required to convert the raw data into information for decision support.  I’ve recently decided to test a few of these new platforms for any of these steps involved.

A few more background on our typical data environment.  Our backend database, ETL, OLAP and programming environment are all Microsoft (SQL Server 2008, Database, Integration Services –ETL, Analysis Services — OLAP).  Our typical datasize for an average client is about 1TB in size for the active database (about 2-3x for the archived portion). 

I do not want to publicly give out the two vendors we’ve tried, but we’ve considered replacing part of our platform with these technologies.  We’ve considered the following scenarios

  1. Eliminate Step 4 entirely: Completely eliminate OLAP cube building and issue queries to the columnar db environment
  2. Point OLAP process to Columnar DB: Keep the OLAP processes but point the OLAP building process to the columnar db environment, since the aggregation queries run faster
  3. Use Columnar DB for calculations in Steps 2 and 3: For calculating user attributes, use the Columnar DB to issue SQL commands

We’ve also considered some of the ETL process migration options, but we quickly gave up on that idea, since the functionality doesn’t really exist in any of the tools we’ve reviewed.

Results

Results were quite disappointing.  In all cases, a properly built and maintained SQL Server has beaten the Columnar DB on the same HW.  Some vendors claim they do better as they are MPP (Massively Parallel Processing), but such claims require hardware investment and we don’t know how they would compare since SQL Server could also be clustered.

We’ve talked to highest levels in their engineering teams and one of them actually visited our offices to really understand the issue.  At the end, SQL server with proper indexing, Storage configuration performs better, since most of the time full table scans are required for many queries, and the columnar db only performs well for ordered dimensions when partial scans are requested.

Based on the performance, we’ve seen no way that these technologies could actually eliminate the need for OLAP environments.  There might be special cases where a non-pre-calculated aggregation is requested, a columnar db might perform better, but for this off-chance 5-10% of the use-cases, the cost is not justified.

One nifty improvement that the columnar DB provide is the storage behavior.  Since data is always saved in column forms, and each column is the same data type, data is compressed much better and this saves significant space.  Although at $250 per 2TB SATA disks, I don’t know how much of a cost saving this would actually bring about.

Ömer Artun, Ph.D.,

CEO | Agilone

Improving response from the house file: beyond RFM (Part 1)

Introduction

One sure source of income for any retailer is people who have bought from them before. If the product you’ve sold is good (and this includes customer service), it is a reasonable assumption that the customer would want to buy from you again.

If you believe this assumption, then a large part of your marketing budget should be used in attracting these people to buy from you again. You can spend money on ensuring top quality after sales customer service, for instance. But here we talk about your direct marketing efforts: reaching these customers in your ‘house file’ via catalogs, mailers, emails and anything else that might showcase the products you want to sell them, products that they might want to buy.

These leads to a lot of relevant questions: What to sell to which customer? How much of your budget should you allocate for direct marketing to existing customers? We do have answers to all of those questions! Do contact us if you’d like to hear more. We’ll come back to those questions later and in this series of posts, focus on response modeling.

Response modeling is just a term for the techniques used towards identifying which customers to focus on first, when precious marketing dollars are being spent in attracting them back. After all, your CEO is not going to give you an unlimited budget! In a perfect world, if you only knew which 50K out of your 500K customers are going to buy from you again in the next two months, you’d mail those 50K people your catalog (or other mailers, emails et al) and they’d see your products, dutifully buy them! But it is not a perfect world, alas. So you need a magic wand: good response modeling! The better the response modeling techniques, the better you can maximize revenue from your customers while minimizing marketing cost, enhancing your ROI. If your response model is good, you’ll end up contacting the more responsive customers – they’ll return and buy. This would not only increase the size of your L12M (last 12 month buyers) file, but it shall be full of people who are more prone to returning and buying from you.

RFM

The industry standard for identifying who to mail is called RFM (Recency, Frequency, Monetary Value). Some companies employ a slight variation, or an extended version as well to improve results. It is intuitive, easy to understand and interpret. However, it has limited utility.

The idea is simple: if a customer purchased from you recently, or purchases from you frequently, or has spent a lot of money with you, they should be sent a sent a catalog, because they would certainly want to buy from you again. There is certainly no argument that ‘how many days it has been since the customer last bought from us?’ (Recency), ‘how many times has a customer bought from us?’ (Frequency) and ‘how much revenue has the customer generated for us?’ (Monetary value) are all excellent variables to try and predict whether the customer shall return to make another purchase. This has been used for years and definitely yielded some good results.

Limitations of RFM

However, this technique has its limitations. At best, this is a model that uses these three highly intuitive predictor variables to predict whether a customer shall return or not. For instance, it severely restricts how companies use their own data. There are so many variables that can be derived from one’s data that can serve as additional excellent predictors.

It limits the terms in which marketing people think of predicting response. Typically, most companies divide all their customers into RFM ‘segments’. Each segment is defined by values of these three attributes: R, F and M. For example, one segment could be ‘Customers who last bought 3-6 months ago, who have bought 3-5 times, who have spent $100 or more’. Then, all segments are ranked from most to least valuable and all customers from the top X most valuable segments are mailed. This makes intuitive sense, but then it limits the marketing thought process towards these segments and makes it hard for people to think in any other terms.

Thus, good, responsive customers might end up in not so valuable segments and thus get ignored for mailings. The opposite might happen as well – not so great customers might end up in valuable segments and can get mailed. A response model that ranks customers by their value, as opposed to the value of their segment can take care of this problem.

Mathematically, another limitation is that often the joint effects of variables get ignored – at best, the RFM segmentation is a CHAID type analysis.

Next up, is a series of examples of our approach to response modeling. At all of our clients, where we have implemented a response model, we have seen at least a 20% improvement over RFM models. We have ensured we approached each client’s data in a customized manner, given the data some pre-modeling treatment (removing outliers etc) and employed the most suitable modeling techniques so as to produce the best results. Keep tuned!

Dhruv Bhargava

Manager Analytics| Agilone

Website: www.agilone.com

Stop over/under mailing your email list – Start adapting email frequency to customer value and online behavior

Email Marketing – a high ROI medium

Many marketers now view email as the best-performing channel in terms of ROI. Email ROI was expected to reach about $45 for every dollar spent in 2008, more than twice the ROI of other mediums (source: marketingcharts.com). In a recent survey from Datran Media, 8 in 10 marketers cited email as one of the strongest advertising channels of their company.
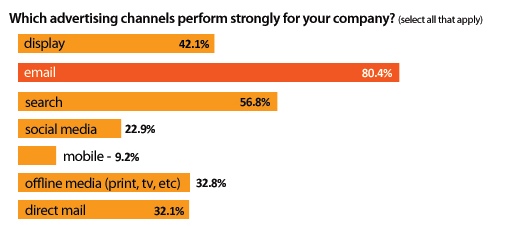
(source: Datran Media, Annual Survey 2009)

(source: Datran Media, Annual Survey 2009)


The real cost of email marketing: unsubscriptions and spam-complaints

Unquestionably, the distribution cost for emails is incredibly low when compared to other channels. One can email one million customers with less than $500. Reaching the same number of customers by mail would cost around half a million dollars (1000 times more).

Due to the cost of mailing, one of the most critical question direct-mail marketers try to answer is: “Is this customer worth being mailed?”. RFM models or advanced response modeling algorithms have to be used to make sure an acceptable ROI is obtained every time.

In the email marketing world, this question is almost meaningless. The entire customer file can be emailed again and again with a very limited budget. For most businesses, a response rate of 0.01% is sufficient to make the ROI positive.

The real cost of an email campaign is not the distribution cost. It is the loss of potential revenue associated to email unsubscriptions and spam-complaints.

Finding a balance between more revenue today and diminished revenue for tomorrow

The more you email a list, the more revenue you can obtain immediately. If you email customers too frequently, you risk spamming them. This could lead them to get on unsubscriptions lists and eventually turning them away from you.

Kirill Popov and Loren McDonald from EmailLabs tell the story in clickz.com of a multichannel retailer who increased its email frequency from 5 messages a month to 12 messages a month. The revenue increased by 38% but the unsubscriptions rate more than doubled from 0.74% to 1.77%. While the actual figures may vary from a business to another, those numbers are in line with what we found during our years of practice.

Getting the good (more revenue) without the bad (unsubscriptions): How to determine the optimal email frequency?

It is surprising to see that very few companies determine optimal email frequency using facts and sound analysis. Most of the time, marketers define an email frequency based on common industry practices, personal experience, and gut feeling.

Email frequency is too important to be left untested. One can even argue there isn’t one optimal frequency. Every customer is different and requires a different email contact strategy.

The approach we usually follow at Agilone is three-fold:

  1. Build a 360 degree view of customers with sales data, web data, and email data
  2. Segment the email list based on customer potential value and email/web activity
  3. Determine the optimal frequency for each segment by using robust A/B testing techniques and a few formulas

Building a 360 degree view of customers with sales data, web data, and email data

The more we know about a customer, the better we are able to target and increase the relevance of our marketing efforts.

At Agilone, we have the technology and expertise to connect to various systems such as order management systems, web analytics solutions (Coremetrics, Omniture, etc.), email marketing solutions (Silverpop, ExactTarget, Responsys, etc). Connecting these dots, we build a robust foundation for all subsequent analytical work

Customer segmentation: Mailing more to high-potential highly-engaged customers

Different customers require different email frequencies. Agilone has defined two dimensions on which customers can be evaluated.

  • Potential value: how much future revenue is expected from a customer/prospect
  • Web/email level of activity: how responsive/engaged is a customer with regard to web and email activity (how often does the customer check the website, how many emails did they open, etc.)

The underlying idea here is that we should email more frequently the customers with high potential value, and who do open all the emails we send, check our website regularly and even forward our emails to friends.

Using advanced statistical modeling, we give a composite score to all customers and prospects. The entire email list is segmented into 10 deciles that we can treat differently.

The top deciles show the best response rates and the lowest unsubscriptions rates when compared to the other deciles, for a same email frequency.

Email Frequency: testing, testing, testing…

Different frequencies can be tested within each of the segments defined above. Let’s say that for a particular segment, we divide the list in two. One half of the segment receives 8 emails per month (let’s call this list A). The second half receives 12 emails per month (list B). As one can expect, we get more revenue from list B but the unsubscriptions rate is lower for list A.

Which frequency should be preferred? Let’s consider the following formula.

Additional profit from higher email frequency =

+  Increase in revenue attributed to higher email frequency

–   Additional distribution costs due to higher email frequency

–   Additional creative costs due to higher email frequency

–   Future revenue loss because of additional unsubscriptions (nb additional unsubscriptions x (future revenue from active email – future revenue from unsubscribed email))

This formula and its various components can produce some great insights.

We will give more examples and details on the three stages above very soon.

I hope you have enjoyed the article. Please continue the discussion by posting your comments here or by shooting an email at info@agilone.com

Read you soon!

Anselme LE VAN

Associate, Analytics | Agilone

Website: www.agilone.com

Harvesting the full potential of email marketing through real analytics – Intro

Email marketing is becoming one of the most preferred marketing tools for communicating and developing relationships with customers.

According to a Jupiter Research forecast, spending on email marketing will reach $1.1 billion in 2010 from $885 million in 2005. In the US, marketing email volumes is expected to reach 838 billion marketing messages in 2013 (source: Forrester 2008).

Email marketing is indeed a powerful way to reach out to customers. More than one-third of internet users say they check their email throughout the day. (source: AOL/Beta Research Corporation, June 2008).

Listening to marketers, I often feel that email marketing is appreciated for three main reasons:

  • LOW COST: while direct mail requires significant marketing budgets, email campaigns can be executed at very low costs. Low costs allows marketers to promote to their entire customer and prospect database (instead of picking up consumers deemed worth a mailing). Also, marketers can execute campaigns much more frequently (an email sent once day a common practice among retailers).
  • EASY ROI CALCULATION: Estimating the realistic ROI of an offline add campaign has always been a tricky issue for marketers. Calculating the ROI of email campaign is easy, simple and automated.
  • SHORT-DELIVERY TIME: we often find that the lead time of a catalog mailing campaign is about 3 months from kick-off meeting to mailing execution date. The lightness of email marketing makes marketers more responsive to purchasing trends. Also a real-time relationship with customers can be engaged with triggered-campaign such as welcome campaigns, abandoned-product campaigns, etc.

Most marketers leverage those three items in a satisfactory manner. However,  we have proven at Agilone that email marketing can do much more. The points listed above are the bare improvement of something that existed before with “traditional” marketing tools.

Taking a broader view, we are convinced Digital marketing heralds the advent of a new marketing paradigm. A new era abundantly researched by scholars where mass marketing is superseded by a personalized uninterrupted relationship between company and consumers. In this new paradigm, marketers personalize their message, offer, timing, and touch strategy for every single consumer relying on the insights produced by advanced analytics techniques.

Email marketing is one of those tools that pave the way for this new era.  However it is surprising to find that it takes quite a long time for marketers to embrace the new possibilities offered by this technology:

  • COLLECTING AND ANALYSING CUSTOMER BEHAVIOR DATA: Like most digital channels, it is now possible to record all customer interactions in an automated and affordable fashion (who open/read their email, how any times, when, what product do they look at, what links do they click on, email forward behavior,…). Tracking and analyzing customer behavior generate great insights and actionable knowledge. For instance, we found that online behavior is a very important predictor of off-line behavior. More details will come on this later on.
  • OFFER PERSONNALIZATION: since the beginning of times, marketers have tried to create meaningful segmentations in order to, among other things, better promote to specific groups of customers. However, the marketing tools available at this time did not allow them to use their segmentations in a very practical manner. For instance, in the catalog business, it is hard to have more than two or three covers and the contact strategy is often resumed to “who should we mail the catalog to?”. With emails, it is now possible to create a personalized offer for every single consumer based on its profile and past behavior. Agilone has developed such tools and can integrate easily to virtually any email marketing solutions (ExactTarget, ConstantContact, SilverPop, etc..). Again, more is to come on this shortly!
  • INTENSIVE TESTING: The ability to track customer behavior and personalize promotions is all marketers need to test, test and test. While testing can be a heavy process in offline marketing, it is very easy now to send different offers, try various layouts or test a variery of touch frequency, etc..

Agilone has developed an impressive expertise and set of capabilities in those areas. We will slowly share our little secrets in the weeks to come. Stay tuned!

Anselme LE VAN

Associate, Analytics | Agilone

Website: www.agilone.com

Ways to enhance response modeling: model the household not the customer

Response Modeling If you run a catalog based retail business – that is, if you are heavily dependent on regular catalog mailers for reaching out to your customers, good response modeling is crucial to cutting marketing costs and enhancing return on your marketing dollars. It is even more crucial to targeting the more responsive customers – enabling you to improve your ROI.

The philosophy is simple: mail the catalogs to people most likely to come back and make a purchase. This way you make the most revenue while mailing the least catalogs.

Getting good at it! There are several mathematical and statistical techniques that can be employed to make a good response model. But even before you start employing fancy math, there’s a lot you can do at the data collection step itself that can improve your modeling. You can sit down and find the most pertinent variables to be considered for the model, for instance.

But an even easier trick is to not model response by customer, but model response by household.

Multiple customers at each household Often, retail businesses attract more than one customer per household. For instance, husband, wife and daughter might have all bought apparel from your catalog – three customers from the same catalog. The database might have even recorded two/three customers when there is really just one – sometimes in their haste to record a sale, the sales rep would have assigned the customer a new customer id. So this new customer might have bought 5 items under Customer ID 1, 3 items under Customer ID 2 and 1 item under Customer ID 3. Really, he’s bought 9 items.

But even if that is not the case, and you happen to be modeling response by customer not household, the following might happen: Husband, wife, daughter all placed 2 orders each – and hence any customer based model might not give any of them a high rank. But the household – has 6 orders! The household itself will get a higher rank in the model, as it should. Someone from the household will make a purchase!

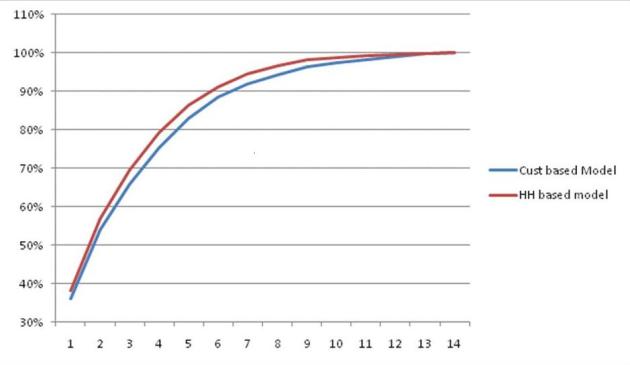
Testing time! In order to test this theory out, we made a customer based response model, then using the same data – first rolled up variables to the household level – then, made a household level response model. We had about 1.4M households to contend with and we ranked each customer/household on its propensity to return and make a purchase. We then ordered these ranks in 100K segments and found out how many customers had returned per segment.

Results Both models ordered the file really well – at 50% of the file, both models had more than 90% of the response coming in. However the house hold based model comfortably beat the customer based one. The graph shows the % of response captured per the each 100K ranks of the two models.

So at 700K, for instance, the customer based model captured 92% of the total responders while the household based model captured 95% of the total response. The usual catalog circulation size for this client was 700K and this improved model would have brought in an additional 3% of the responders for the same number of catalogs mailed. This would have equated to roughly $77K per month – an amount of no insignificance.

Or looking at it another way, the new model would have brought in the same amount of money by mailing 100K lesser catalogs (since the new model brings in the 92% response at the 600K mark). At the cost of 70 cents a catalog, that’s a saving of $70K to earn the same revenue as before.

Gains charts for both models

Modeling by household thus provides a definite edge over modeling by customers. Not only is it a win in monetary savings, or increase revenue through your catalog mailing, it also ensures you send out one catalog – for each household. This way you get that one catalog for getting a sale from any or all of the possible customers you have there.

Dhruv Bhargava

Manager Analytics| Agilone

Website: www.agilone.com

Blog: https://agilone.wordpress.com